
Macro Thoughts
Macro Thoughts
Beneath the Surface of The Labor Markets and Fun Facts About Election Years

Thought to ponder…
“One of the things that distinguishes a black belt in jiu-jitsu from a white belt is the black belt’s understanding of what is important and what isn’t. A black belt sees past insignificant movements, ignores trivial actions, and focuses on what actually matters. A good commander on the battlefield does the same thing. The commander can tell when enemy shooting is merely reconnaissance by fire. A good commander understands when enemy movement is just a ploy. A good commander ignores things that will not have an actual impact on the battle. Like the black belt and the battlefield commander, any good leader must be able to do the same thing: discriminate between what is important and what is not.”
Jocko Willink
Leadership Strategy and Tactics
The View from 30,000 feet
Welcome 2024! The new year ushered in a wave of repositioning against a backdrop of overbought conditions and a healthy dose of Fed uncertainty. From a fundamental standpoint, last week’s data was job-centric. The net outcome of labor data was that headline numbers, Claims and the Unemployment Rate, came in hotter than expected, while the more nuanced numbers that are thought to provide a better indication of direction, such as the Quits Rate, the Hiring Rate, Labor Participation, ISM survey data on employment intentions, Temp Services workers, overtime trends and Indeed industry job posting, all point to a softening in the labor markets. The message of labor market strength mixed with a subtle weakening (for those who look hard enough) was enough to motivate Secretary of the Treasury Yellen, who has mostly stayed out of the spotlight in regards to calls on the economy, to declare a soft-landing has arrived. Unfortunately for the financial markets, last week’s data, which may have reinforced the soft-landing narrative, also had the effect of calling into question the need for the volume of rate cuts markets are expecting in 2024, which in turn caused a repricing of Treasuries and pressuring of equities. Meanwhile geopolitical tensions are shaking inflation expectations with the Houthi’s capturing the spotlight by disrupting global supply chains and restoking inflation fears.
The Focus Point Leading Market Indicator (FPLMI) picks up momentum, continuing in Neutral Conditions for January
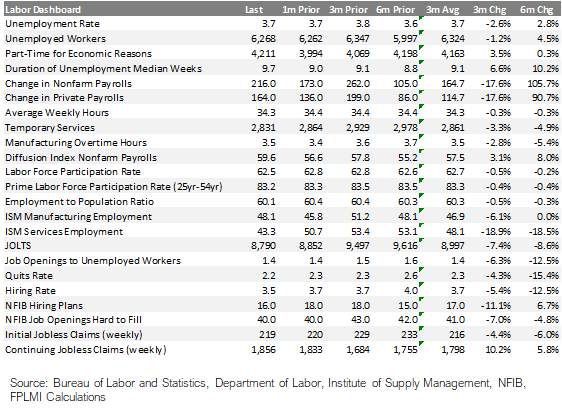
Labor Market Dashboard signals continued strength, mixed with weakening trends
Fun facts about S&P500 performance during election years since1952
The most Frequently Asked Question from clients this week: What are the latest trends in delinquencies, defaults and bankruptcies?
Introducing the Focus Point Sector Heatmap
The Focus Point Leading Market Indicator (FPLMI) picks up momentum – Neutral for January

The Focus Point Leading Market Indicator (FPLMI) improved slightly at the end of December, reflecting improvements financial conditions, Fed policy stance, increased credit availability and strong coincident economic data.
Apart from 1995, there are few analogs to base assumptions of a soft-landing, so actual data, rather than forecasts, will dominate market action in 2024, which may lead to volatility as investors attempt to read the path of the Fed into data prints.
To the degree the labor market remains strong, consumer spending shows resiliency supporting earnings, there is stable supply and demand for credit in the economy, inflation continues to subside and interest rates begin to fall, a soft-landing becomes increasingly likely. That was the story in December.
However, we do not expect a smooth path because the formula we just outlined will be mapped against weekly data releases which will likely cause manic reactions to the degree that the data points offer a different course for rates or the economy
Coincident indicators continue to point to resilient growth in excess of expectations


Labor Market Dashboard signals continued strength, mixed with weakening trends
Last week’s claims and payrolls shook markets because the headline unemployment rate and claims numbers aren’t budging. However, a more complete inventory of labor market indicators and their direction provides a more wholesome picture of a labor market that is weakening under the surface.

Underneath the surface – industry specific weakness and below pre-pandemic trends abound


Fun facts about S&P500 performance during election years since1952
In the 72 years since 1952, there have been 18 Presidential election years. During Presidential election years the S&P500 was up 83% of the years, while during the entire 72-year history the S&P500 was only up 72% of the years.
Ten of the elections took place when the incumbent President was a Republican and eight took place when the incumbent President was a Democrat.
The average return of fourth year of the election since 1952 when the incumbent President was a Republican was +3.82%
The average return of fourth year of the election since 1952 when the incumbent President was a Democrat was +11.41%
The average annual return of the S&P500 since 1952 during the fourth year of the President’s term was +7.19%. This compares with the average annual return of the S&P500 for all years since 1952, which was +9.02%.
The average return during each of the quarters of Presidential election years was:
Q1 +0.05%
Q2 +0.92%
Q3 +0.52%
Q4 +0.81%
Some generalizations: Historically, the S&P500 has a better than average chance of being up during an election year but tends to be up less than an average year. When a Democrat is the incumbent, the election year has tended to be nearly four times as strong than when a Republican is the incumbent. Positive returns during election years have historically been concentrated in the last three quarters of the year.
Election year dynamics: better batting average than most, concentrated in second half of year


FAQ: What are the latest trends in delinquencies, defaults and bankruptcies?
Delinquencies
Subprime auto loans 60+ day delinquency rates fell as low as 2.6% during 2021 and have sense rebounded to about 6.0%, which is roughly inline with pre-pandemic trends.(Fitch)
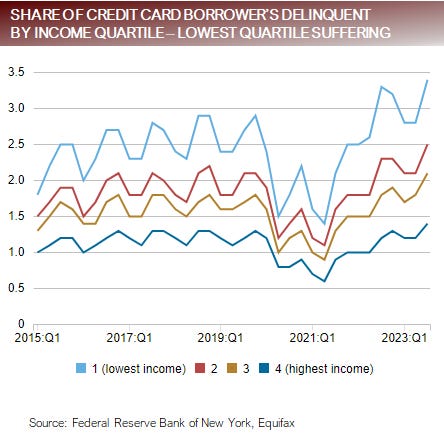
Credit card delinquencies have returned to pre-pandemic trends for Baby Boomers, Gen X and Millennials, but are now peeking above pre-pandemic levels for Gen Z, with the highest concentration of delinquencies is concentrated in the lowest quartile of income. (NY Fed)
Defaults
Corporate Defaults (Fitch)
Leverage Loans High Yield
2022 1.60% 1.35%
2023 3.04% 2.99%
2024(e) 3.5% to 4.0% 5.0% to 5.5%
Bankruptcies
Bankruptcies increased by 18% in 2023 from 378k in 2022 to 445k in 2023, however still trail below 2019, when bankruptcies topped 758k. (Reuters)
Bottom Line
Delinquencies, defaults and bankruptcies are all getting dramatically worse, however in the larger picture, they are mostly just returning to pre-pandemic trends. The looming question is, will these measures stall at pre-pandemic trends are continue to deteriorate?
Concentration of delinquencies in lowest income earners and subprime

Sector Rotation Heat Map
Focus Point Sector Rotation
Relative Weights

The Focus Point Sector Rotation Model is a combined trend following and mean reversion model that utilizes seven factors to analyze daily price data on sectors to determine the strength of upward trends.
The purpose of the model is to provide information to guide relative over or underweight of sectors in the S&P500 based on a daily reweighting of risk.
Each week FPLMI, beginning January 1, 2024, FPLMI will publish the results of the Focus Point Sector Rotation Model for the close of the previous week.
Putting it all together
The markets came out the gate to a poor start in 2024. There were a lot of culprits that involved:
Overbought conditions and repositioning as the year started
Jitters about the Fed Meeting Minutes not being a bowl of cherries for those expecting six rate cuts in 2024
Hotter than expected headline employment numbers
Houthi terrorists attacking cargo ships in the Red Sea, threating to gum up international supply chains and drive-up shipping rates
Coincident indicators continue to point to resiliency, but there is a subtle deterioration underneath the surface that has carried many of the employment and credit indicators of the economy back to pre-pandemic levels. As we approach pre-pandemic levels for data, the question becomes, will the indicators level off or continue to deteriorate?
So far 2024 looks like more of the same from a macro perspective – the direction of equities is being dictated by rate and policy expectations. The big take-away last week was the markets took perceived good news about the labor markets as bad news because the data was believed to reduce the probability of rate cuts.
To the degree coincident data continues to show signs of strength it will erode market expectations for the pace of rate cuts and pressure yields higher, creating a headwind for equities. These same dynamics, taken to more of an extreme, may eventually restoke inflation fears. What this means for equity prices as the year progresses is complex because higher growth and stabile inflation would also support higher earnings and may eventually lift equity prices.