
Macro Thoughts
Macro Thoughts
Comparing Markets from 2022 Highs to 2024 Highs

Thought to ponder…
“The law of non-interference with nature. — The law of non-interference with nature is a basic principle of Taoism [stating] that one should be in harmony with, not rebellion against, the fundamental laws of the universe. Preserve yourself by following the natural bends of things and don’t interfere. Remember never to assert your self against nature; never be in frontal opposition to any problems, but to control it by swinging with it.”
Bruce Lee and John Little
Bruce Lee Striking Thoughts
The View from 30,000 feet
The big news last week was the end of the 746-day streak since the last closing high of the S&P500. On Friday, the S&P500 took out its 2022 high (1/3/2022), driven by a late week flurry of buying which reversed the early week attitude of “good news is bad news” and replaced it with a “good news is good news” attitude to round out the week. Tuesday doldrums were tied to excessively good news on Retail Sales, which shook investor conviction that the Fed would need to embark on an aggressive rate cutting campaign of 6-7 cuts in 2024, despite the endless parade of Fed President speakers who have been trying to convince the markets otherwise since December. By Friday, animal spirits couldn’t be contained, when better than expected Jobless Claims data on Thursday combined with an upside surprise in consumer sentiment on Friday to propel the markets higher. A funny thing happened along the way that we haven’t seen for a while, rates moved higher, and equity prices moved higher, an unusual break to the trend we’ve seen where equities weakness has been linked to higher rates. Before we get too excited about a change in correlations, let’s try and remember one week does not make a trend. At the same time, before we get overwhelmed by despondence, let’s step back and remember, it’s really about the direction travel for the Fed more than the path. To that end, barring a resurgence in inflation, the destination of rates is clearly lower, with the path being less certain, and that’s something to be optimistic about in the intermediate term.
What the S&P500 looked like at the last high versus the current high
Surprising movement in S&P500 sector metrics under the surface since the last high
A deeper look at the Magnificent 7 from the market highs in 2022 to 2024
Focus Point Sector Rotation Update: A return to the leadership of 2024, with the addition of Financials, Industrials and Healthcare
What the S&P500 looked like at the last high versus the current high
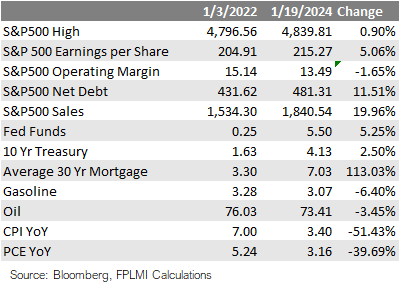
Things to consider about the S&P500 being at a new high. Since the last high in the S&P500, 746 days ago:
On the positive side
Sales have increased almost 20%, with Earnings per Share increasing 5%
The average price of gasoline is down 6.4%, and a barrel of oil as fallen 3.5%
The annual change in CPI has been cut in half
The annual change in PCE has fallen by 40%
On the negative side
Operating Margins have fallen 1.65%
Net Debt has increased 11.5%
Fed Funds have increased by 5.25%
The 10-year Treasury Yield has increased 2.5%
The average 30-yr mortgage rate has over doubled
Easy to make the case for mixed feeling about new highs for the S&P500


Surprising movement in S&P500 sector metrics under the surface since the last high

You might be surprised to know since the last time the S&P500 traded at its high:
Energy has been the top performing sector, not Tech, and that 8 out 11 Sectors turned in negative performance since the last high
Real Estate was the worst performing sector, but Consumer Discretionary, as market sweetheart because of AMZN, was the second worst
Tech margins have decreased, while Real Estate margins have increased
Apart from Energy, the largest percentage earnings growth took place in Industrials and Consumer Discretionary
Apart from Energy, Utilities and Consumer Staples had the largest percent increases in Sales
Apart from Energy, Financials and Industrials had the largest percent increases in market capitalization
For all the talk of Tech and Comm Services, under the surface, movements might surprise you


A deeper look at the Magnificent 7 from the market highs in 2022 to 2024

Fun Facts about the Magnificent 7 between the market highs of 2022 and 2024:
The earnings growth of Tech, Comm Services and Discretionary, the three big sectors within the Magnificent 7, from the 2022 to 2024 high, were respectively, 7.9%, -0.8% and 22.8%, while the average earnings growth of the Magnificent 7 was 44.8%.
For all the talk of the Magnificent 7’s dominance of weighting in the S&P500, only META, MSFT and NVDA increased as a percentage of the S&P500 from highs of 2022 to the highs of 2024, the remainder became a lesser percent of the S&P500.
The three strongest names in the Magnificent 7 were AMZN, MSFT and NVDA, on average grew earnings over 80% since the 2022 high.
The major increases in value in the Magnificent 7 were in NVDA and MSFT, who together saw their market caps rise $1.1T, while the remainder of the names in the Magnificent 7 had their combined market caps fall $0.7t.
Within the Magnificent 7, NVDA stood out by a wide margin as the largest driver of gains


A return to the leadership of 2024, with the addition of Financials, Industrials and Healthcare

The Focus Point Sector Rotation Model is a combined trend following and mean reversion model that utilizes seven factors to analyze daily price data on sectors to determine the strength of upward trends.
The leadership sectors of 2023 have returned to the top of the leader board, led by NVDA, which is up 21% for the year.
New additions to leadership in 2024 are centered around cyclicals.
Concerning is concentration, with each week in 2024 having a larger proportion of sectors entering negative trends.
Narrow breath across geographies and market caps is even more alarming, with only 3 countries out of the 26 we follow producing positive returns for 2024 (US, Japan and India), and within the US only large caps having a positive return, with mid caps and small caps negative on the year.
Putting it all together
We devoted this issue of Macro Thoughts to the path we’ve traveled over the last 746 days since the last high on the S&P500. What’s really changed?
NVDA has by far been the driver that has kept the markets churning high. NVDA did get a little help from MSFT and AMZN, but the rest of the Magnificent 7 were less magnificent over the last couple years.
While Sales for the S&P500 increased almost 15% and Earnings increased almost 11% since the last time the S&P500 was at this level, margins have collapsed 165 points. This is bad news if you believe that inflation will be slowing dramatically in 2024 because earnings are measured in nominal Dollars so it will be much harder to grow earnings when Sales aren’t being artificially boosted by inflation.
The fact that the S&P500 can reach new highs when Fed Funds has increased 525 bps and the average 30-yr mortgage rate has over doubled is not something that many people would have predicted in 2022.
Although the markets are at new highs, under the surface the gains are once again concentrated in select sectors and a larger number of sectors are entering negative trends each week, which is not a sign of strength.
The larger picture is that inflation continues to fall at a faster pace than expected, the labor market remains strong, which is causing resiliency in demand and corporate profits. It’s hard to be pessimistic with this as the backdrop, but with expectations for S&P500 earnings to grow at 11.8% in 2024, well above historical averages, and six rate cuts priced in versus a Fed that’s broadcasting three cuts, it’s also hard to feel like the markets aren’t priced for perfection.