
Macro Thoughts

Thought to ponder…
“A collection of talented individuals without personal discipline will ultimately and inevitably fail. Character triumphs over talent.
James Kerr
Legacy
The View from 30,000 feet
Last week was inflation week, with data reports including CPI, PPI, Import and Export Prices as well as an update on Inflation Expectations from the New York Fed and the University of Michigan Survey. The bottom line is that the disinflationary trends of 2023 have dissipated and inflation expectations starting to edge higher. This is bad news for the Fed, who had explicitly stated at the last Fed meeting that they needed additional “confidence” that disinflationary trends would continue. There has been very little since the last Fed meeting to reassure policy makers that the trends in disinflation will persist. Market pricing of Fed Funds Futures continue to push rate cuts out to later in the year. The markets have transitioned from expecting six to seven cuts this year to expecting two to three. The fact that the S&P500 is still up over 6% this year despite this reset in rate expectations speaks to the strength of the upward trend. Another important data release last week was Retail Sales, which disappointed investors with a miss to the downside and negative revisions. Together the combination of an uptick in inflation and a downtick in consumer spending brought with it the most notable catch phrase of the week, “the specter of stagflation”. All year market pundits have been calling for increased breadth in equity markets. Last week we noted this trend should contain a “careful what you wish for” moniker. Although 7 out of 11 sectors are beating the S&P500 this month, the average return of those 7 sectors is 2.3%, versus the S&P500 which is up 0.3%. The challenge is, without mega cap leadership, it will be tough for the S&P500 Index to move appreciably higher.
Two notable trends in news stories centered around Stock Market Bubbles and the Neutral Fed Funds Rate
Upside inflation surprises tied to auto insurance and housing, hopes for disinflation hinge on housing and wages
Retail sales downshift, signs of retrenchment
The most Frequently Asked Question from clients this week: What are some of the wildcards that may influence the markets this year not being focused on?
Focus Point Sector Rotation Update: Leadership tilting towards defensives and inflation hedging sectors
Notable trends in news stories related to Stock Market Bubbles and the Neutral Fed Funds Rate
There has been a notable uptick in two topics covered in the media: Stock Market Bubbles & Neutral Fed Funds Rate
Stock Market Bubbles
The basic premise most of the discourse surrounds the influence of the Magnificent 7 on equity market performance since the equity market low in October 2023, that has lifted the index over 24% from that low point, or dating further back to the low in October 2022, that has lifted the market over 43% from that low point.
While comparisons range from tulips in 1637 to the NASDAQ in 2000, the conclusion of most who look at the issues highlights differences. The predominate disimilarity is that the companies that have been responsible for the run up in the S&P500 are the companies with earnings growth. It hasn’t been a wild speculative frenzy tied to pie in the sky promises of future performance.
Ray Dalio wrote a linkedin article addressing the question of if we are in a bubble by analyzing a variety of indicators he thinks are important to gauging if a bubble is in the making (linked below), and concludes the equity markets look “frothy but not bubbly”.
https://www.linkedin.com/pulse/we-stock-market-bubble-ray-dalio-zpdre
Neutral Fed Funds Rate
The Federal Reserve Bank of St. Louis posted a blog related to their thoughts on the Neutral Interest Rate, the short-term interest rate when the economy is at both full employment and exhibits stable inflation (link below).
They conclude that the Neutral Interest Rate may have risen since the end of the pandemic due to higher Productivity and a permanent increase in public debt.
The net result is that the Neutral Interest Rate, which over the last decade was in the 2.0% to 2.5% range, may have migrated higher but 0.5% to 1.00%, giving the Fed less distance to travel to get back to neutral.
Stock market bubbles and higher neutral rates, signal investor skepticism of rally’s durability


Upside surprises in auto insurance and housing, hopes for disinflation hinge on housing and wages
CPI came in slightly hotter then estimates. It’s not the fact that CPI comes in a fraction of a percent that’s troubling as much as it is that CPI has been essentially flatlined between 3.0% and 3.7% since June of 2023, with no appreciable progress.
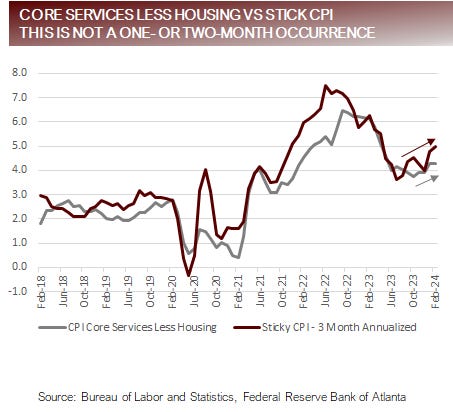
CPI Core Services Less Housing printed at 4.30% and is a key indicator of trend that the Fed is closely watching. This measurement has been trending higher since October, when it bottomed at 3.75%.
The same upward pressure is presenting in PPI where a miss to the upside was more pronounced. PPI Final Demand, came in at 1.6%, missing survey estimates of 1.2% by a wide margin, driven by a steady evaporation of disinflationary influences in Transportation and Warehousing Services.
Market pundits defending the disinflationary story were quick to point out that over half of the rise in CPI could be attributed to fictitiously calculated Shelter component, and a quarter of the uptick was related to auto insurance.

Progress on inflation since the summer/fall of 2023 has stalled, and inputs beginning to trend higher

Retail sales downshift, signs of retrenchment
Retail Sales increased 0.6%, missing survey expectations of 0.8%, with the prior period revised from -0.8% to -1.1%.
Retail Sales have been driven by a variety of factors over the last year that may be losing momentum. These factor include:
Dwindling in fiscal-fueled pandemic savings
Saving swelled to nearly $2.5t at the peak and are now down to less than $500m.
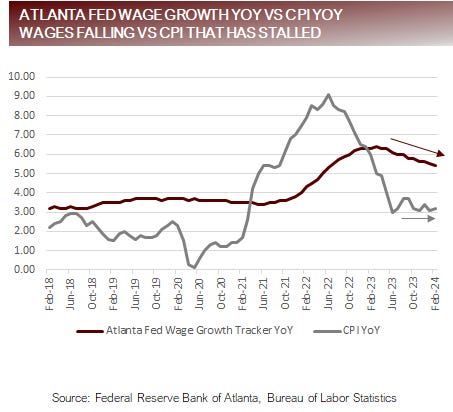
Contracting real wage growth
In June of 2023 the Atlanta Fed Wage Growth Tracker measured 6.1% and CPI YoY measured 3.0%. Fast forward to today, The Atlanta Fed Wage Growth Tracker has fallen to 5.4% and CPI YoY has risen to 3.2%. The net message is that over the last six months wage growth has cooled while pricing pressures have increased, which amounts to consumers feeling poorer.
The limits of saving drawdowns
Personal Savings as a Percentage of Disposable Income is currently 3.8%, after hitting a post-pandemic low of 2.7% in June of 2022. The theory of why savings had dropped was tied to a strong labor market and large cash reserves allowing consumers save less. With the recent uptick in unemployment, along with a host of other data indicating that the labor markets are cooling, and the dwindling of fiscal-fueled pandemic savings, consumers may begin increasing savings which would draw from spending.
Recent research from the Federal Reserve Bank of San Francisco concludes “liquid assets, which more readily fund spending, have been diminishing and are approaching levels significantly lower than the projected pre-pandemic path. As these excess liquid funds run out, consumers may decide to pull back on spending.”
Factors to consider that may indicate the US consumer may begin slowing their pace of consumption

FAQ: What are some of the wildcards that may influence the markets this year not being focused on?
The resiliency in the US economy surprised a lot of people last year (including me). The strength was multifaceted group of factors that collectively provided an upward thrust to the economy and financial markets.
Below are some of the less talked about factors that drove 2023, that may not provide the same sort of momentum in 2024.
Immigration
The Brookings Institute recently published a summary that highlighted the CBO projections for net immigrations for 2023 were 1.0m, but the actual net flow of migrants was 3.3m. The influx of immigrants was a boon to the economy. The most recent projections are that immigration trends will subside in the coming years may not provide the same upward thrust of economic momentum.
Fiscal Support
The current Fiscal Deficit as a % of GDP is -6.4%. It is unprecedented to have a deficit this size in the US outside a recession or war. Massive deficits lead to an ever-increasing national debt. This won’t matter until suddenly it does. As the day of reckoning approaches each time there is a spike in rates bond vigil antes will gain the upper hand a drive market volatility.
Some factors that provided tailwinds in 2023 may prove to be less powerful in 2024 (possible negatives), while new opportunities may provide potential for upside (possible positives).
Possible Negative Surprise: Deterioration in financial conditions
Financial conditions are the loosest they’ve been since the immediate aftermath of the pandemic in 2021. Although they can stay loose a while longer, historically when financial conditions reach these level, they rarely stay there for longer than six months.
Possible Positive Surprise: Resurgence of growth from international developed markets
Copper and Oil have both recently broken out and have done so in unison with international manufacturing PMIs bottoming, which may be signaling turning point for international developed markets.
There are hidden factors such as immigration and clues such as commodities that signal changes


Focus Point Sector Rotation Update: Leadership tilting towards defensives and inflation hedges


The Focus Point Sector Rotation Model is a combined trend following and mean reversion model that utilizes seven factors to analyze daily price data on sectors to determine the strength of upward trends.
Last year’s leadership sectors of Info Tech, Comm Services and Consumer Discretionary continue their trends down the depth charts as their technicals deteriorate for another week.
Defensive and more traditional inflation hedge sectors have moved into leadership positions and are exhibiting positive short-term upward trend signals.
Putting it all together
The delicious cocktail the market was served early in the year that consisted of disinflationary forces, above trend growth and a strong labor market that supported a resilient consumer has been replaced with a foul-tasting brew of stubborn inflation, continued above-trend growth and a weakening labor market that is calling into question the ongoing strength of the consumer.
The Fed emphasized after its last Open Market Committee Meeting that they need to see additional data to support the disinflationary trends to gain “confidence” that inflation was headed back to the targeted range, which would guide them to embark on an easing cycle in 2024.
Since the Fed’s last meeting the Fed has repeatedly stated they feel it would be appropriate to ease in 2024, but the data just isn’t cooperating. What was dismissed in January as one or two data points calling into question disinflationary trends has multiplying over the last two months and now looks like a pattern of sideways inflationary forces.
The markets have been well behaved so far, as expectations for rate cuts have been slashed from 6 or 7 to 2 or 3. However, we’ve noted that when the 10-year crossed 450 last summer, the equity markets reacted poorly. With the 10-year hovering at 430 and a Fed meeting looming this week, there’s not much daylight between here and 450.
The coming week’s outcome likely hinges on the Fed statement, press conference and new Summary of Economic Projections, which will either serve to calm nervous markets or take agitate them.